重要提示:
请勿将账号共享给其他人使用,违者账号将被封禁!
重要提示:
请勿将账号共享给其他人使用,违者账号将被封禁!
题目
考虑以下美国GDP的数据:
| 年份 | 名义GDP(10亿美元) | GDP平减指数(1996年是基年) |
| 2000 | 9873 | 118 |
| 1999 | 9269 | 113 |
 更多“考虑以下美国GDP的数据: 年份 名义GDP(10亿美元) GDP平减指数(1996年是基年) 2000 987”相关的问题
第1题
考虑一个生产并消费热狗与汉堡的经济。下表是两个不同年份的数据。
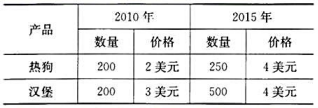
a.把2010年作为基年,计算每年的以下统计值:名义GDP、实际GDP、GDP的隐性价格平减指数,以及CPI这种固定权重价格指数。
b.在2010年和2015年之间,价格上涨了多少百分比?对每种产品以及GDP平减指数和CPI这两个总体价格水平的衡量指标,给出你的答案。比较这两个拉氏和帕氏价格指数(以上两个价格指数分属拉氏和帕氏价格指数)给出的答案。解释其差别。
第2题
考虑一个生产并消费面包和汽车的经济。下表中是两个不同年份的数据。
[
2000年 | 2010年 | |
一辆洗车的价格 | 50000美元 | 60000美元 |
一个面包的价格 | 10美元 | 20美元 |
生产的洗车的数量 | 100辆 | 120辆 |
生产的面包的数量 | 500000个 | 400000个 |
a.把2000年作为基年,计算每年的以下统计数字:名义GDP、实际GDP、GDP隐含的价格平减指数,以及像CPI这样的固定加权数物价指数。
b.在2000年和2010年之间,物价上升了多少?比较拉斯派尔和帕氏物价指数给出的答案。解释其差别。
c.假设你是一位议员,写了一份社会保障与联邦养老金指数化的提案。这就是说,你的提案建议调整这些津贴以抵消生活费用的变动。你将用GDP平减指数,还是用CPI?为什么?
Consider an economy that produces and consumes bread and automobiles. In the following table are data for two different years.
[
Year | Year | |
2000 | 2000 | |
| Price of an automobile | $50.000 | $60.000 |
| Price of a loaf of bread | $10 | $20 |
| Number of automobiles produced | 100 | 120 |
| Number of loaves of bread produced | 500.000 | 400.000 |
a.Using the year 2000 as the base year, compute the following statistics for each year: nominal GDP, real GDP, the implicit price deflator for GDP, and a fixed-weight price index such as the CPI.
b.How much have prices risen between year 2000 and year 2010? Compare the answers given by the Laspeyres and Paasche price indices. Explain the difference.
c.Suppose you are a senator writing a hill to index Social Security and federal pensions. That is, your bill will adjust these benefits to offset changes in the cost of living. Will you use the GDP deflator or the CPI? Why?
第4题
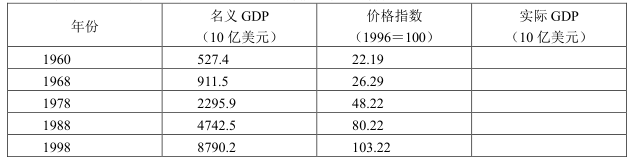
如果已知下列名义GDP的数值(如表12-1所示),计算真实GDP。
表12-1 年份物价表
|
第6题
根据下表数据解决以下三个问题
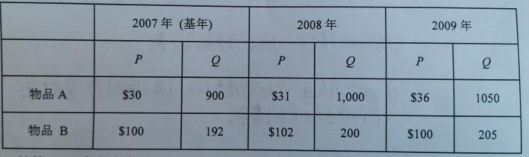
1.计算2007年的名义GDP
2.计算2008年真实GDP
3.计算2009年的GDP平减指数
第8题
根据以下图表资料,回答问题。 以下图表数据来自世界银行和WSTS(世界半导体行业统计协会),反映了1991—2010年20年间全球GDP增长率和半导体行业销售收入的增长率对比? 请根据下面的图表回答后面的问题。

1991—2010年中,全球GDP增速最高的年份是()。
A.2004年
B.2000年
C.2010年
D.1995年
 相关内容
相关内容

 警告:系统检测到您的账号存在安全风险
为了保护您的账号安全,请在“赏学吧”公众号进行验证,点击“官网服务”-“账号验证”后输入验证码“”完成验证,验证成功后方可继续查看答案!